How to Analyse Financials for IPO Company (Retail-Friendly Guide)
Published on 24 Apr 2026, Friday
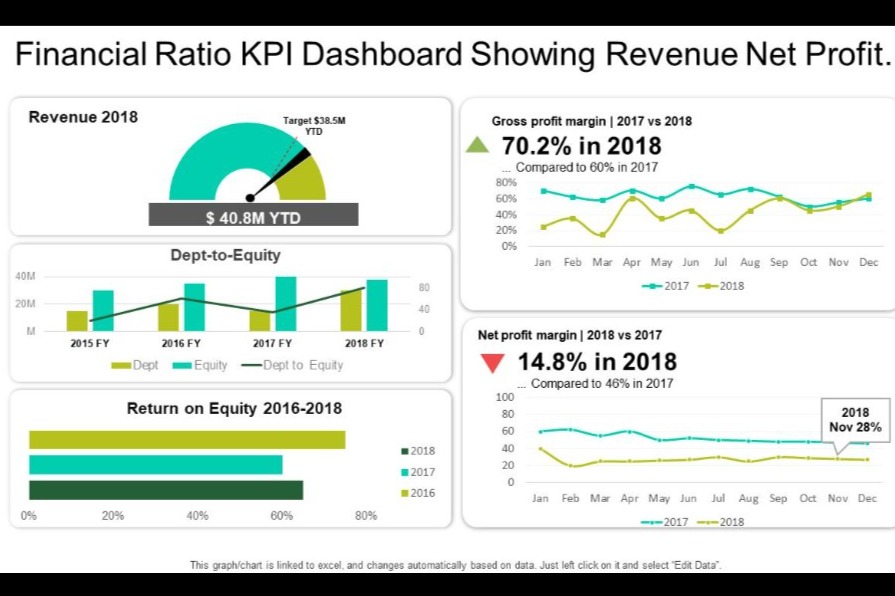
How to Analyse Financials for IPO Company (Retail-Friendly Guide)
Published on 24 Apr 2026, Friday
Why Financial Analysis Matters in IPOs When a company launches an IPO, you’re investing before market validation. Financial analysis helps you answer one key question: 👉 Is this business worth the price it is asking?
Step 1: Check Revenue Growth
Look at revenue for the last 3–5 years in the DRHP/RHP.

What to check:

Consistent growth (not sudden spike)
Industry-aligned growth
Avoid companies with flat or declining revenue

Example Insight:

Good: ₹500 Cr → ₹800 Cr → ₹1,200 Cr
Risky: ₹500 Cr → ₹520 Cr → ₹1,500 Cr (sudden jump)

👉 Sudden growth may be temporary or manipulated through one-time contracts
Step 2: Profitability
Check:

Net Profit
EBITDA
PAT margins

Key Questions:

Is the company profitable?
Are margins improving?

Healthy Sign:

Profit growing faster than revenue

Red Flag:

Revenue rising but profit stagnant or falling
Step 3: Profit Margins
Focus on:

EBITDA Margin
Net Profit Margin

Why it matters:
Margins show efficiency + pricing power

👉 Compare with industry peers (very important)

Simple Rule:

Higher than peers = strong business
Lower than peers = competitive pressure
Step 4: Debt Analysis
Check:

Total Debt
Debt-to-Equity Ratio

Ideal Situation:

Low or reducing debt

Red Flag:

High debt + IPO money used to repay loans

👉 This means IPO is not for growth, but for survival.
Step 5: Cash Flow
Check:

Operating Cash Flow (OCF)

Golden Rule:
👉 Profit without cash flow = danger

Good Sign:

Positive and growing cash flow

Bad Sign:

Profit positive but cash flow negative
Step 6: Return Ratios
Focus on:

ROE (Return on Equity)
ROCE (Return on Capital Employed)

Ideal Benchmark:

ROE > 15%
ROCE > 15%

👉 Higher ratios = efficient management
Step 7: Valuation
Check:

P/E Ratio
Price to Sales (P/S)

Compare with:

Listed peers

Decision Logic:

Overpriced IPO = Avoid / Caution
Fairly priced = Consider
Undervalued = Opportunity
Step 8: Use of IPO Funds
Read this section carefully in DRHP.

Good Use:

Expansion
New projects
Debt reduction (partially)

Bad Use:

Only debt repayment
Promoter exit (OFS heavy)
Step 9: Key Red Flags
Watch out for:

Sudden profit jump before IPO
High receivables (money not collected)
Negative cash flow
Promoters reducing stake heavily
Frequent related party transactions
Final IPO Financial Checklist
Before applying, ask:

✔ Is revenue growing steadily?
✔ Is the company profitable?
✔ Are margins strong vs peers?
✔ Is debt under control?
✔ Is cash flow positive?
✔ Are returns (ROE/ROCE) good?
✔ Is valuation reasonable?

👉 If most answers are YES → Strong IPO candidate
👉 If many NO → Avoid or high risk


Most retail investors only see GMP or subscription numbers.

👉 But smart investors combine:

Financial strength
QIB subscription
Valuation

This gives a complete IPO picture
Disclaimer
This content is for educational purposes only. We are not SEBI-registered advisors. IPO investments are subject to market risks, including potential loss of capital. Always do your own research before investing.
Key Financial Terms Explained (IPO Analysis Made Simple)
Net Profit
What it means:
Final profit after all expenses, tax, interest.

Formula (simple):
Revenue – All Expenses = Net Profit

How to analyse:

Growing = good sign
Declining = warning

👉 This is the real earning of the company
EBITDA
Full Form: Earnings Before Interest, Tax, Depreciation & Amortisation

What it means:
Profit from core business (ignores financing & accounting effects)

Why important:

Shows operational strength
Useful for comparing companies

👉 High EBITDA = strong business operations
PAT Margin (Profit After Tax Margin)
Formula:

PAT Margin = Net Profit / Revenue × 100

What it means:
How much profit company earns from ₹100 sales

Example:

10% margin = ₹10 profit per ₹100 revenue

👉 Higher margin = better efficiency
Total Debt
What it means:
Total loans taken by company

How to analyse:

High debt = risky
Low debt = safer

👉 Always check if IPO money is used to repay debt
Debt-to-Equity Ratio
Formula:

Debt/Equity =  Total Debt / Shareholder Equity

What it means:
How much company depends on borrowed money

Ideal:

< 1 = safe

2 = risky

👉 High ratio = financial pressure
Operating Cash Flow
What it means:
Actual cash generated from business

Important Rule:
👉 Profit is accounting, cash is reality

Good Sign:

Positive & growing OCF

Bad Sign:

Profit high but cash flow negative
ROE (Return on Equity)
Formula:

ROE = Net Profit / Shareholder Equity × 100

What it means:
How efficiently company uses investors’ money

Ideal:

15% = strong

👉 Higher ROE = better management efficiency
ROCE (Return on Capital Employed)
Formula:

ROCE = EBIT / Total Capital × 100

What it means:
Return generated from total capital (equity + debt)

Why important:

Better than ROE when company has debt

👉 High ROCE = efficient use of capital
P/E Ratio (Price to Earnings)
Formula:

P/E = Share Price / Earning Per Share

What it means:
How much investors are paying for ₹1 earnings

Example:

P/E = 20 → paying ₹20 for ₹1 profit

How to analyse:

Compare with peers
High P/E = expensive
Low P/E = cheap (or weak business)
Price to Sales (P/S Ratio)
Formula:

P/S = Market Value / Revenue

What it means:
How much investors are paying for ₹1 sales

When useful:

Loss-making companies
Early-stage companies

👉 Lower P/S is generally better
| Metric      | What It Tells       |
| ----------- | ------------------- |
| Net Profit  | Final earning       |
| EBITDA      | Business strength   |
| PAT Margin  | Profit efficiency   |
| Debt        | Financial risk      |
| Debt/Equity | Leverage level      |
| OCF         | Real cash           |
| ROE         | Return to investors |
| ROCE        | Capital efficiency  |
| P/E         | Valuation vs profit |
| P/S         | Valuation vs sales  |
Pro Tip (Important for IPORupee Users)
Most people:
👉 Only see GMP + Subscription

Smart analysis:
👉 Combine

Financials (above metrics)
QIB subscription
Valuation

This is where your platform can dominate if you simplify this visually.
Disclaimer
This content is for educational purposes only. We are not SEBI-registered advisors. IPO investments are subject to market risks, including potential loss of capital.